At a foundational level, network monitoring and management tools are the software and hardware stacks that provide visibility and control over an IT network’s infrastructure. Their primary function is to track performance metrics, identify anomalies, and ensure all connected devices, services, and data pathways operate within defined performance and security parameters.
Why Network Monitoring Is a Core Function for IT Operations

Attempting to manage a modern network without the appropriate tooling is an exercise in futility. It’s analogous to directing air traffic control without radar; you’re aware of constant data packet ingress and egress but lack the visibility to detect congestion, prevent collisions, or efficiently route traffic to its destination. This is the operational chaos network monitoring tools are designed to mitigate.
These systems provide a real-time, consolidated view of every device, connection, and data flow across the entire infrastructure. This capability shifts the operational posture from reacting to end-user complaints about application latency or service outages to proactively identifying and remediating bottlenecks before they impact business operations. It is a fundamental transition from reactive troubleshooting to strategic, data-driven network management.
The Three Pillars of Network Oversight
Effective network management is not a monolithic function; it is built on three core pillars that work in concert to maintain infrastructure health and performance. Each pillar addresses a distinct but deeply interconnected aspect of IT operations.
- Monitoring for Stability: This is the foundation, involving the continuous collection of health and status data from network components like routers, switches, servers, and firewalls. It answers the fundamental question: “Are all components online and operating within expected parameters?”
- Managing for Peak Performance: This pillar extends beyond simple uptime. The focus here is on optimizing data flow, managing bandwidth allocation, and ensuring critical applications receive the necessary network resources to meet service level agreements (SLAs). This pillar answers, “Is the network operating at optimal efficiency?”
- Securing Against Threats: In contemporary architectures, monitoring is a critical security function. By analyzing traffic patterns, these tools serve as a first line of defense in detecting anomalous activity, unauthorized device connections, or the traffic signatures indicative of a potential security breach.
This integrated approach is the primary driver behind the market’s expansion. Valued at approximately USD 1.5 billion in 2024, the global network monitoring tools market is projected to more than double, reaching USD 3.2 billion by 2033. This growth reflects the critical role these tools play in ensuring both operational efficiency and security posture as reliance on digital infrastructure intensifies. You can dive deeper into these trends in the full report on network monitoring tool market growth.
“A network key performance indicator (KPI) is a measurement and benchmark for achieving optimal network performance goals. To support these goals, measuring actual performance against the KPI goals helps the network team make decisions to improve and sustain network performance and service levels.”
Foregoing robust network monitoring is not a cost-saving measure; it is a significant operational risk. A single hour of downtime can incur substantial financial and reputational costs. By investing in the right network monitoring and management tools, IT teams gain the essential visibility and control needed to ensure operational continuity, enhance productivity, and fortify the organization’s overall security posture.
Understanding Core Network Monitoring Protocols
To effectively implement network monitoring, one must first understand the protocols that enable communication between management platforms and network devices. These protocols facilitate the data exchange between a central management console and every component on the network—from switches and firewalls to servers and access points.
These protocols are the workhorses that collect the raw data feeding performance dashboards, triggering alerts, and guiding troubleshooting efforts. They are what make proactive network management technically feasible. For any IT professional, a solid grasp of their mechanics is fundamental to selecting the right tools and performing effective root cause analysis.

SNMP: The Universal Translator for Network Devices
The Simple Network Management Protocol, or SNMP, is one of the most established and widely adopted protocols for network management. It functions as a standardized communication layer for a diverse IT infrastructure. Nearly every manageable network device, regardless of vendor, includes a built-in SNMP agent. This agent acts as the local interpreter, responding to queries from a central Network Management Station (NMS)—the monitoring tool itself.
This interaction occurs through several distinct operations:
- SNMP Get: The NMS actively polls a device to request specific MIB (Management Information Base) objects, such as current CPU load or interface traffic counters.
- SNMP Set: An NMS can issue a command to modify a device’s configuration. This operation is used judiciously due to its potential impact.
- SNMP Traps: Devices can proactively send an unsolicited alert, or “trap,” to the NMS upon a specific event, such as a port state change or a critical temperature threshold being exceeded. This is vital for real-time fault detection.
At its heart, SNMP allows a monitoring system to query any device, “What is your current state?” and receive a standardized, quantifiable response. This standardization is what enables network monitoring and management tools to oversee a heterogeneous, multi-vendor environment from a single pane of glass.
Packet Sniffing: Deep Packet Inspection
While SNMP is effective for querying device health, it provides limited insight into the actual data traversing the network. For this, a different technique is required: packet sniffing, also known as packet capture or network traffic analysis. This method involves capturing and inspecting individual data packets as they travel across a network segment.
This technique allows an administrator to pull a packet from the wire and examine its contents in granular detail: its source and destination, the transport protocol (e.g., TCP/UDP), the application protocol (e.g., HTTP, DNS), and the data payload itself. This level of deep-dive analysis is invaluable for diagnosing complex application performance issues or identifying security threats embedded within the data stream.
Flow Analysis: The High-Level Traffic View
Packet sniffing provides immense detail, but capturing every packet on a high-traffic network can be resource-intensive and generate an overwhelming volume of data. This is where flow analysis protocols like NetFlow, sFlow, and J-Flow provide a more scalable solution. They offer a high-level view of traffic patterns without the overhead of full packet capture.
Instead of inspecting individual packets, network devices like routers and switches aggregate traffic into “flows”—a unidirectional sequence of packets between a specific source and destination sharing common characteristics. For each flow, the device records key metadata:
- Source and destination IP addresses
- Source and destination ports
- IP protocol type
- The total number of bytes and packets in the flow
This summarized flow data is then exported to a flow collector (part of the monitoring tool). The collector analyzes this data to map traffic patterns, identify top talkers and listeners consuming bandwidth, and detect anomalous traffic behavior. This helps answer strategic questions like, “Which application is consuming the most bandwidth?” or “Is there unexpected traffic between our internal network and a specific external IP?” This macroscopic view is essential for capacity planning and network performance optimization.
What to Look For in a Network Management Tool
Understanding data collection protocols is the first step; knowing what capabilities to look for in a tool is the next. When selecting a network monitoring and management tool, a core set of features separates basic platforms from those that deliver deep, actionable insights.
The right features empower IT teams to not just observe the network, but to actively manage it with precision. A basic tool might offer simple up/down status, but an advanced platform provides a full diagnostic dashboard, predictive alerting, and automated topology mapping.
The following image illustrates the three pillars that support a robust network monitoring strategy.
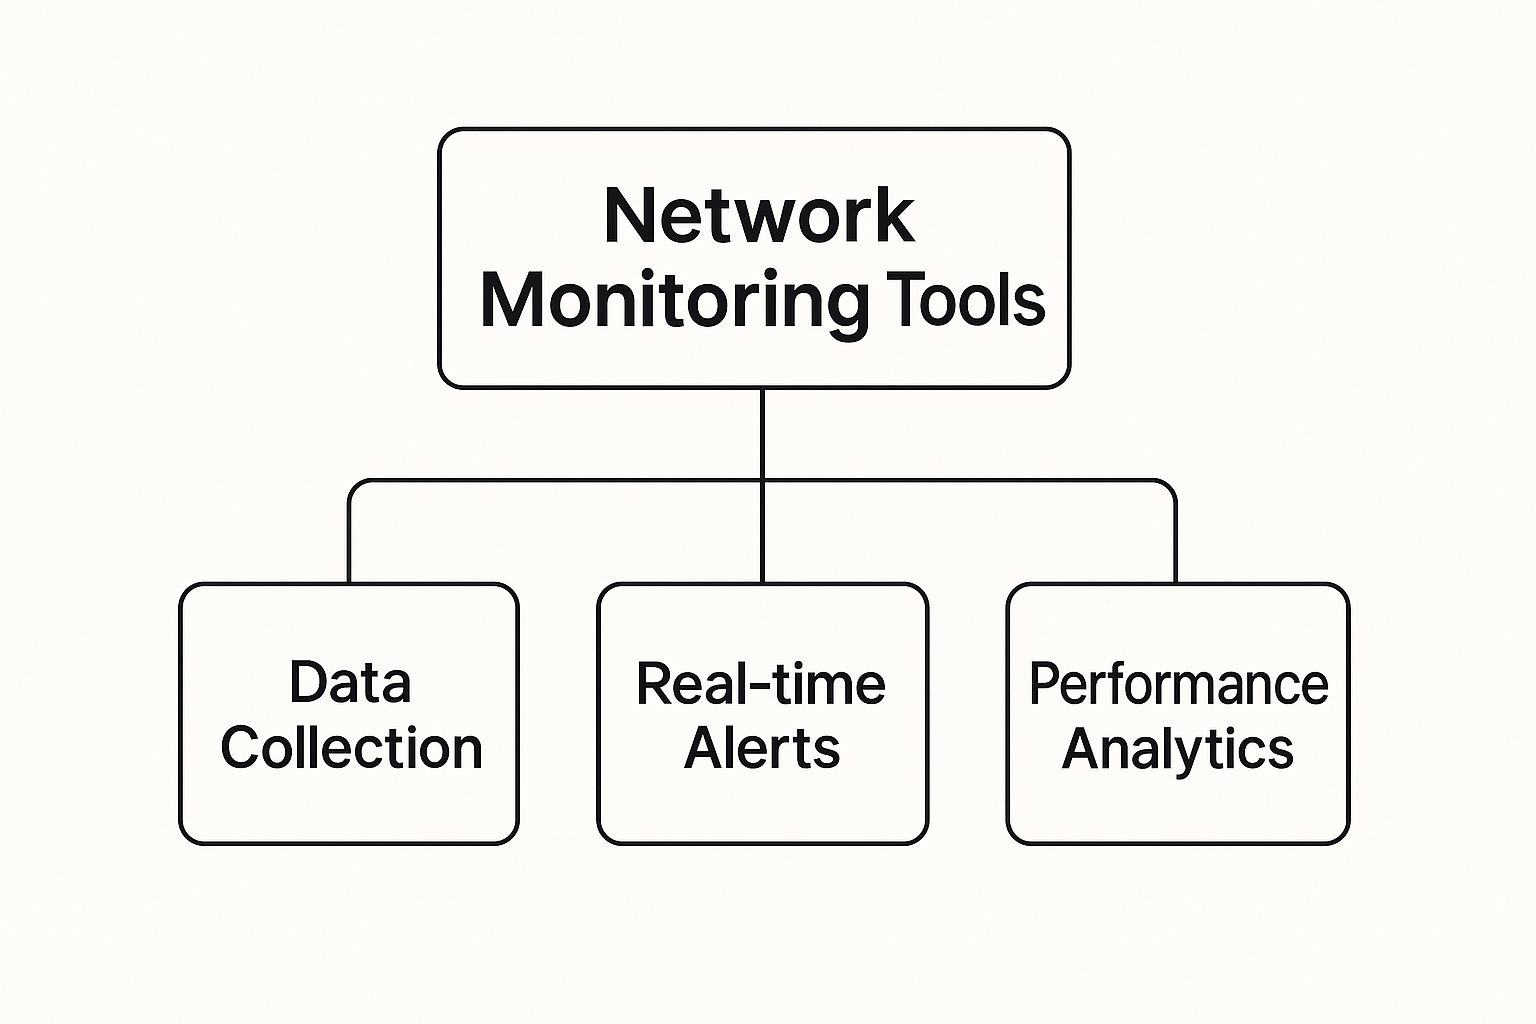
As shown, the entire process is built on a foundation of data collection. That data then fuels the real-time alerting and performance analytics necessary for informed decision-making.
To help evaluate potential solutions, the following table highlights the essential features of any modern network management platform.
Essential Features of Modern Network Monitoring Tools
| Feature | Core Function | Key Benefit for IT Professionals |
|---|---|---|
| Real-time Dashboards | Provides a live, visual representation of network health and key performance indicators (KPIs). | Enables instant identification of performance anomalies, reducing Mean Time to Identify (MTTI) and Mean Time to Resolve (MTTR). |
| Automated Discovery & Mapping | Continuously scans the network to find all connected devices and generates a visual topology map. | Eliminates manual documentation, provides an up-to-date Layer 2/3 view of the infrastructure, and accelerates onboarding for new team members. |
| Intelligent Alerting | Uses customizable, condition-based rules to send context-rich notifications for specific events. | Mitigates “alert fatigue” by ensuring only meaningful, actionable warnings are sent to the appropriate personnel, improving response times. |
| Historical Data & Reporting | Stores performance metrics over long periods to analyze trends and generate comprehensive reports. | Facilitates a shift from reactive troubleshooting to proactive management, aids in capacity planning, and provides data to justify infrastructure upgrades. |
Each of these features plays a distinct but interconnected role. Together, they create a comprehensive system that not only helps resolve issues as they occur but also enables proactive prevention.
Real-time Performance Dashboards
The core of any effective network management tool is its dashboard. This must be a dynamic, real-time command center displaying the network’s vital signs at a glance. Key metrics should include latency, jitter, packet loss, and bandwidth utilization across critical links and devices.
A well-designed dashboard translates millions of raw data points into intelligible charts and graphs. This visual context is critical for spotting issues that would otherwise be lost in voluminous log files.
Use Case: An e-commerce site experiences a sudden degradation in performance during a flash sale. The network team reviews the dashboard and immediately observes a sustained bandwidth spike saturating a specific WAN link, pinpointing the bottleneck in seconds. They can then implement traffic shaping or adjust QoS policies to mitigate the issue.
Automated Discovery and Network Mapping
Modern networks are dynamic; devices are added and configurations change constantly. Automated network discovery is an essential feature that continuously scans the network to identify and inventory all connected infrastructure—from routers and switches to servers and firewalls.
The tool then leverages this data to generate and maintain an up-to-date network topology map. This visual representation of the infrastructure is indispensable, particularly in complex, large-scale, or poorly documented environments.
- Real-world example: A new network administrator joins an organization with a poorly documented network. Instead of spending weeks manually tracing cables and parsing configuration files, she initiates the auto-discovery feature. Within an hour, the tool generates a complete logical map, providing an immediate and accurate understanding of the entire topology.
Intelligent and Customizable Alerting
Excessive, low-value notifications lead to “alert fatigue,” where important warnings are missed. The best tools offer intelligent, customizable alerting systems that go beyond simple static thresholds (e.g., “CPU > 90%“).
This includes setting multi-level thresholds, creating rules based on correlated conditions (e.g., alert only if CPU utilization is high and latency exceeds a baseline), and routing specific alerts to the appropriate teams via email, SMS, or integrated platforms like Slack. The objective is to deliver meaningful, context-rich notifications that warrant immediate action.
Historical Data and Trend Reporting
While real-time data is crucial for incident response, historical data is essential for strategic planning. A top-tier tool will store performance metrics for extended periods (weeks, months, or years). This repository of information allows for trend analysis and comprehensive reporting.
By analyzing this historical data, IT teams can transition from a reactive to a proactive operational model. This data underpins effective network performance optimization strategies, helps justify hardware upgrades, assists in capacity planning, and aids in diagnosing intermittent, recurring issues.
- Real-world example: An IT manager receives recurring complaints about slow application performance at a branch office at month-end. By analyzing historical data, he identifies a clear pattern: bandwidth saturation coincides with the accounting team’s month-end reporting processes. Armed with this empirical evidence, he can justify a circuit upgrade for that branch before the next cycle, preventing a recurrence.
How to Choose the Right Network Monitoring Tool
Selecting the right network monitoring and management tool is a strategic decision that directly impacts IT operational efficiency. The market is saturated with options, and the “best” choice is highly dependent on your specific operational requirements, existing technology stack, and business trajectory. A correct choice becomes a force multiplier; a poor one results in expensive shelfware.
The goal is to identify a tool that not only resolves current challenges but also scales to meet future demands as the organization evolves. This decision is significant, especially considering the investment. The network monitoring market is valued at approximately USD 2.4 billion in 2025 and is projected to reach USD 4.2 billion by 2032. This reflects the criticality of these platforms for maintaining the performance of modern business operations. You can find more data behind this trend and learn about the factors driving the market growth.
Assess Your Scalability Needs
For any growing organization, scalability is arguably the most critical evaluation criterion. The tool selected today must be capable of supporting the network of tomorrow. You must ask: can this platform monitor twice the number of devices, interfaces, and sites without performance degradation or prohibitive cost increases?
For a small-to-medium business (SMB) with an expanding remote workforce, scalability translates to the ability to easily onboard and monitor new remote offices or SOHO environments. The ideal tool must manage a distributed, dynamic network without requiring dedicated IT staff at each location.
An enterprise managing a sprawling hybrid-cloud environment has different scalability requirements. They need a tool that can monitor thousands of virtual servers, cloud-native applications, and the complex East-West traffic flows between different cloud providers. For them, the solution must scale horizontally to ingest and process massive volumes of data from disparate sources.
Evaluate Integration Capabilities
No network tool operates in a vacuum. Its value is magnified by its ability to integrate with the broader IT ecosystem. Interoperability between tools creates a unified, efficient, and highly automated workflow.
Key integrations to evaluate include:
- ITSM Platforms: Can the tool automatically generate a trouble ticket in a system like ServiceNow or Jira when a critical alert is triggered?
- SIEM Systems: Can it forward relevant security logs and flow data to your security information and event management platform for deeper threat correlation and analysis?
- Communication Tools: Can it push alerts directly into collaboration channels on Slack or Microsoft Teams to accelerate incident response?
A tool with poor integration capabilities becomes a data silo, forcing manual correlation and context-switching between different systems, which increases MTTR.
Choosing a tool with a robust API and pre-built integrations is akin to hiring a new team member who already speaks the same language as the rest of the team. It streamlines communication and creates a more cohesive operational model.
Calculate the Total Cost of Ownership
The initial license fee is only one component of the overall investment. To accurately assess the long-term financial impact, you must calculate the Total Cost of Ownership (TCO). TCO encompasses the initial purchase price plus all associated costs incurred over the tool’s lifecycle. Understanding these costs is as critical as efforts to reduce network latency and improve performance.
Be sure to factor in these ancillary expenses:
- Implementation and Setup: The time and resources required for deployment, configuration, and integration.
- Training and Onboarding: The time investment required for the team to achieve proficiency with the new system.
- Hardware Requirements: For on-premises deployments, the server and storage infrastructure costs.
- Ongoing Maintenance: This includes annual support contracts, version upgrades, and the staff-hours required for administration.
Choose Your Deployment Model
Finally, you must decide between an on-premises deployment and a Software-as-a-Service (SaaS) model. Each has distinct advantages.
An on-premises solution provides complete control over the data and the underlying infrastructure. However, you are responsible for managing the hardware, security, and software updates. This model is often preferred by organizations with strict data sovereignty requirements or highly customized network environments.
Conversely, a SaaS solution offloads all infrastructure management to the vendor. This enables faster deployment and predictable subscription-based costs. It is an excellent fit for teams that want to focus on leveraging the tool’s capabilities rather than maintaining it, offering operational agility without significant upfront capital expenditure.
The Future of Network Management and AIOps

The field of network management is evolving beyond simple threshold-based alerting and manual troubleshooting. We are entering an era defined by intelligence and automation, where network monitoring and management tools are transforming from passive observers into active, intelligent partners in maintaining network health. This evolution is driven by AIOps—Artificial Intelligence for IT Operations.
AIOps represents a paradigm shift in network oversight. Instead of tasking human operators with the impossible challenge of correlating events across thousands of disparate data streams, AIOps leverages machine learning (ML) algorithms to perform this analysis at scale. This enables a far more sophisticated and proactive approach to management.
The Rise of Predictive Analytics
Traditional monitoring is inherently reactive; it excels at reporting on events that have already occurred. The future lies in prediction. AIOps platforms analyze vast quantities of historical performance data to identify subtle patterns that are precursors to service degradation.
ML algorithms can detect minuscule, anomalous deviations in metrics like latency, jitter, or traffic flow that a human operator would likely miss. This allows IT teams to remediate a failing switch or a congested link before it escalates into a service-impacting outage.
For example, an AIOps system might identify a router’s memory utilization creeping up incrementally every Tuesday afternoon, preceding a brief period of performance degradation. A human might dismiss this as a transient issue. The algorithm, however, flags it as a predictive indicator of a memory leak, prompting an investigation before a device crash occurs.
Monitoring Complex Modern Architectures
Contemporary networks are more complex than ever. The clear demarcation between on-premises data centers and the cloud has dissolved into complex hybrid environments. Technologies like SD-WAN have introduced dynamic, software-defined network overlays that can change topology on a second-by-second basis. Monitoring these architectures with legacy tools is ineffective.
- Hybrid Cloud: Effective monitoring must track application performance seamlessly as workloads migrate between private infrastructure and public cloud providers like AWS or Azure.
- SD-WAN: With SD-WAN, traffic paths can change dynamically based on real-time link conditions. A modern tool must be able to visualize and analyze these dynamic routes to ensure policy enforcement and optimal performance.
This explosion in complexity is a primary driver for the growth in the monitoring market. Projections show the global market for monitoring tools expanding from USD 43.28 billion in 2025 to USD 185.78 billion by 2034. This growth is directly correlated with the business adoption of these intricate IT infrastructures, which demand more intelligent, real-time oversight.
The ultimate goal is to evolve the network administrator’s role from a reactive firefighter, constantly addressing incidents, to a strategic architect who designs and oversees a self-optimizing, intelligent network fabric.
Toward Autonomous Networks
The logical progression of AIOps is the autonomous, self-healing network. In this emerging model, network monitoring and management tools will not just predict problems—they will automatically remediate them. This is the core concept of automated remediation.
Consider this workflow:
- Detection: An AI model flags anomalous latency on a critical application’s primary WAN link.
- Analysis: The system immediately correlates this with traffic data from flow exporters, identifying ISP congestion as the root cause.
- Remediation: It then executes a predefined automation runbook, automatically adjusting Quality of Service (QoS) rules to de-prioritize non-essential traffic and rerouting the critical application’s flow over a healthier secondary link.
The IT team receives a notification that an issue was detected and resolved automatically. There is no user impact and no emergency incident response. This frees up skilled engineers for high-value strategic initiatives, such as network architecture design or security hardening, rather than routine operational tasks. For those looking to implement this level of granular control, a proper quality of service setup is a foundational prerequisite. This future is not science fiction; it is the clear evolutionary trajectory for network operations.
We Get These Questions All The Time
Even for seasoned IT professionals, navigating the landscape of network monitoring and management tools can be complex. Evaluating options, obtaining accurate information, and justifying the required budget present significant challenges.
Here we address some of the most frequent questions from IT professionals in the field, providing direct answers to aid in making informed decisions for your organization.
What’s The Real Difference Between Monitoring and Management?
This is a common point of confusion, as the terms are often used interchangeably. While closely related, they represent two distinct and critical functions.
- Network Monitoring is the function of observation and data collection. It is the passive gathering of metrics on device health (CPU, memory), traffic patterns (flow data, packet analysis), and performance (latency, jitter, packet loss). Its primary role is to provide the empirical data required to understand the state of the network.
- Network Management is the function of taking action based on the data provided by monitoring. This includes device configuration, implementing Quality of Service (QoS) policies, deploying security patches, and executing remediation tasks to resolve issues identified through monitoring. It is the active, hands-on component of network operations.
A useful analogy is an automobile’s instrument cluster versus its controls. The dashboard (monitoring) displays speed, engine temperature, and fuel level. The steering wheel and pedals (management) are the controls used to operate the vehicle based on that data. Both are essential for safe and efficient operation.
How Do I Justify The Investment In a New Tool?
Securing budget approval for a new IT tool can be challenging, particularly if an incumbent system is perceived as “good enough.” The key is to frame the investment not as an IT cost, but as a driver of business value and a risk mitigation strategy. The argument must be articulated in terms of business outcomes.
Instead of focusing on technical features like “better visibility,” construct a business case built on quantifiable data and potential ROI. Effective angles include:
- Downtime Costs: Calculate the cost of one hour of network downtime to the business in terms of lost revenue, lost productivity, and SLA penalties. If a superior tool can prevent even a single major outage per year, it often provides immediate ROI. For many enterprises, this cost is measured in tens or even hundreds of thousands of dollars per hour.
- Operational Efficiency: Track the engineering hours spent on reactive troubleshooting for recurring, undiagnosed issues. A powerful tool can significantly reduce Mean Time to Resolution (MTTR), freeing up senior engineers for strategic projects rather than constant firefighting.
- Proactive Problem-Solving: Position the tool as an enabler for shifting from a reactive “break-fix” model to a proactive operational posture. Demonstrate how historical data and trend analysis can identify and facilitate the replacement of degrading hardware before it causes a service-impacting failure.
The most compelling arguments are backed by data. Presenting leadership with a quantitative analysis of the risk of inaction versus the measurable ROI of investing in a robust network management solution shifts the conversation from an IT expenditure to a strategic business decision.
Are Agent-Based or Agentless Tools Better?
This is a long-standing debate where the correct answer is contingent on the specific environment, security policies, and monitoring objectives. Neither approach is inherently superior; they involve different technical trade-offs.
An agent-based tool requires the installation of a software agent on each monitored endpoint.
- Pros: Agents can collect highly granular, detailed data from the host operating system. They are often considered more secure as they typically initiate outbound, encrypted connections, which simplifies firewall rule sets.
- Cons: Deployment and lifecycle management can be complex. Installing, updating, and maintaining agents across a large or dynamic environment can create significant administrative overhead.
An agentless tool utilizes standard network protocols like SNMP, WMI, or SSH to collect data remotely. It does not require installing any software on the target devices.
- Pros: Deployment is typically faster and simpler. You provide the tool with network credentials and target IP ranges, and it can begin data collection almost immediately.
- Cons: This approach can have security implications, as it may require opening administrative ports on devices. The data collected may also be less granular than what a dedicated agent can provide, particularly for application-level metrics.
Many modern platforms now offer a hybrid approach, allowing agentless monitoring for network infrastructure and agent-based monitoring for critical application servers where deep visibility is required. The optimal choice is the one that aligns with your operational workflow and security posture.
Ready to gain complete control over your network performance? The tools from Mushroom Networks Inc. provide powerful SD-WAN and broadband bonding capabilities that ensure your business stays connected and productive. By combining multiple internet links into a single, resilient connection with advanced QoS, you can eliminate downtime and guarantee a superior user experience. Learn more about how to build a faster, more reliable network at https://www.mushroomnetworks.com.